SPC Control Charts Pack
X̄-R, I-MR, and p-charts with limits and rule violations built in.
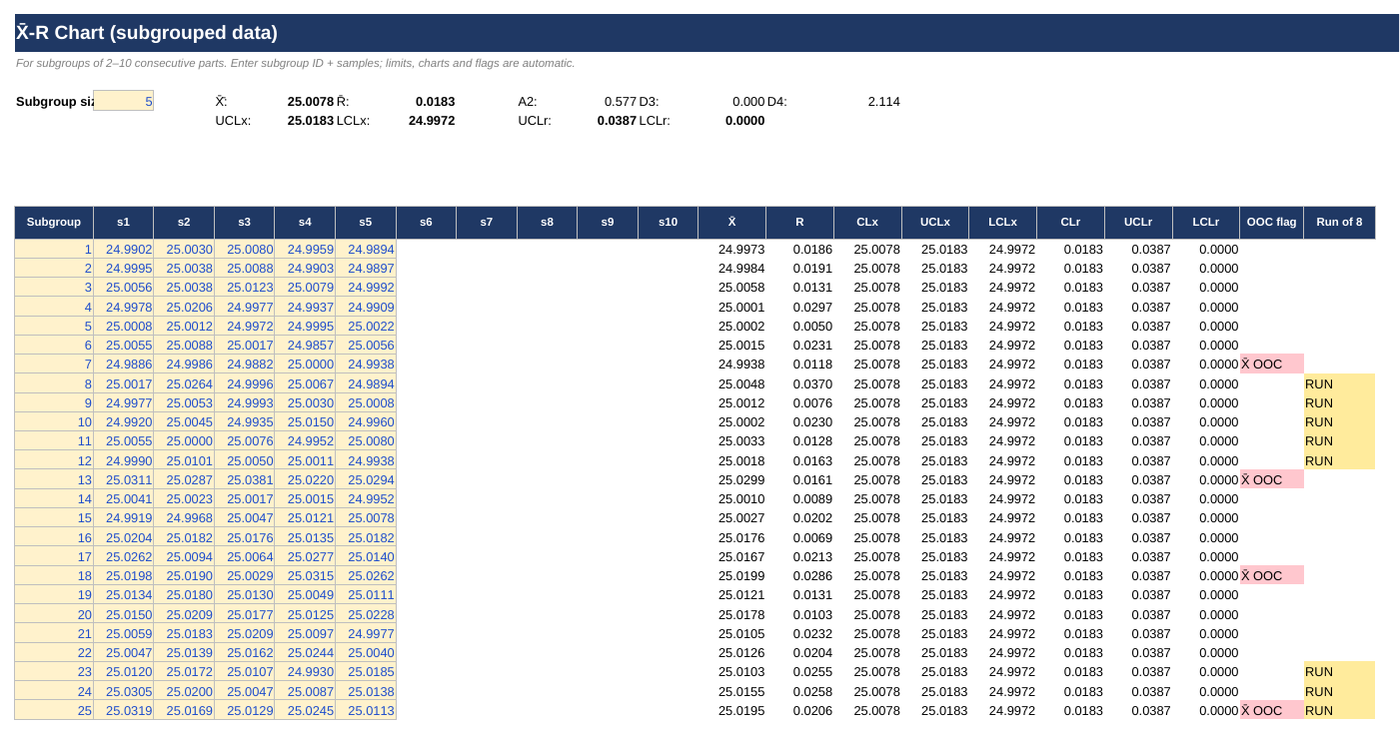
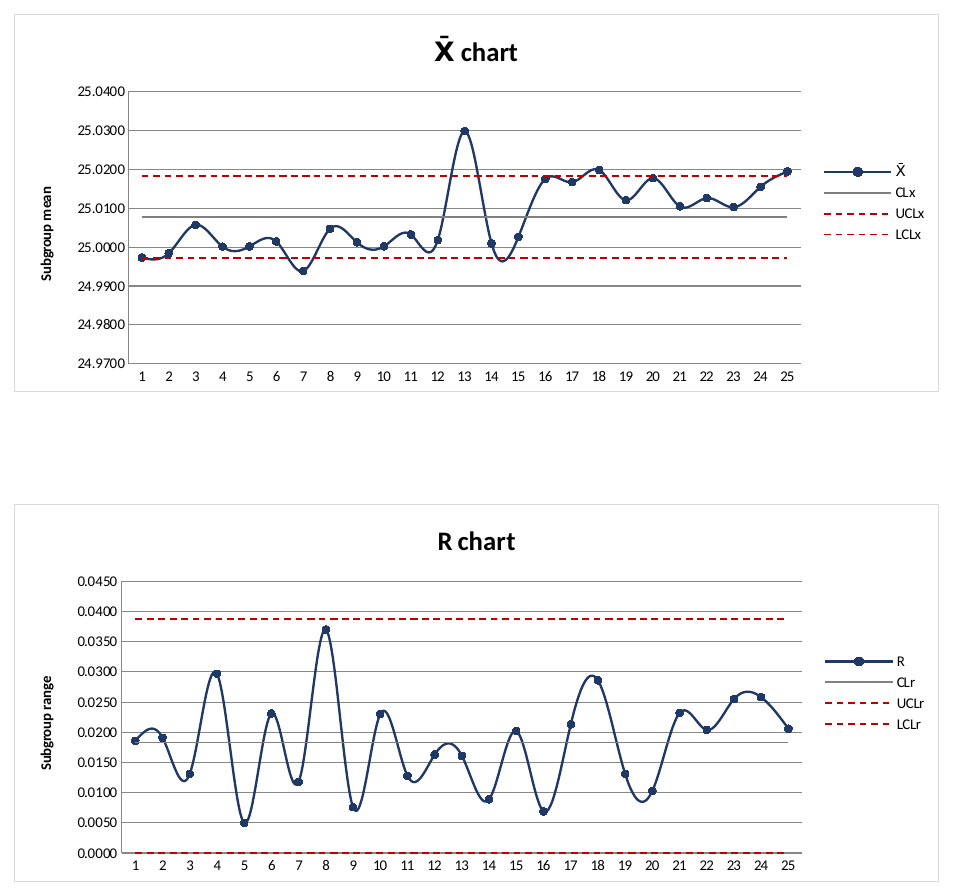
- Xbar-R — subgroups of 2–10, constants auto-selected
- I-MR — individuals with 2.66 / 3.267 limits
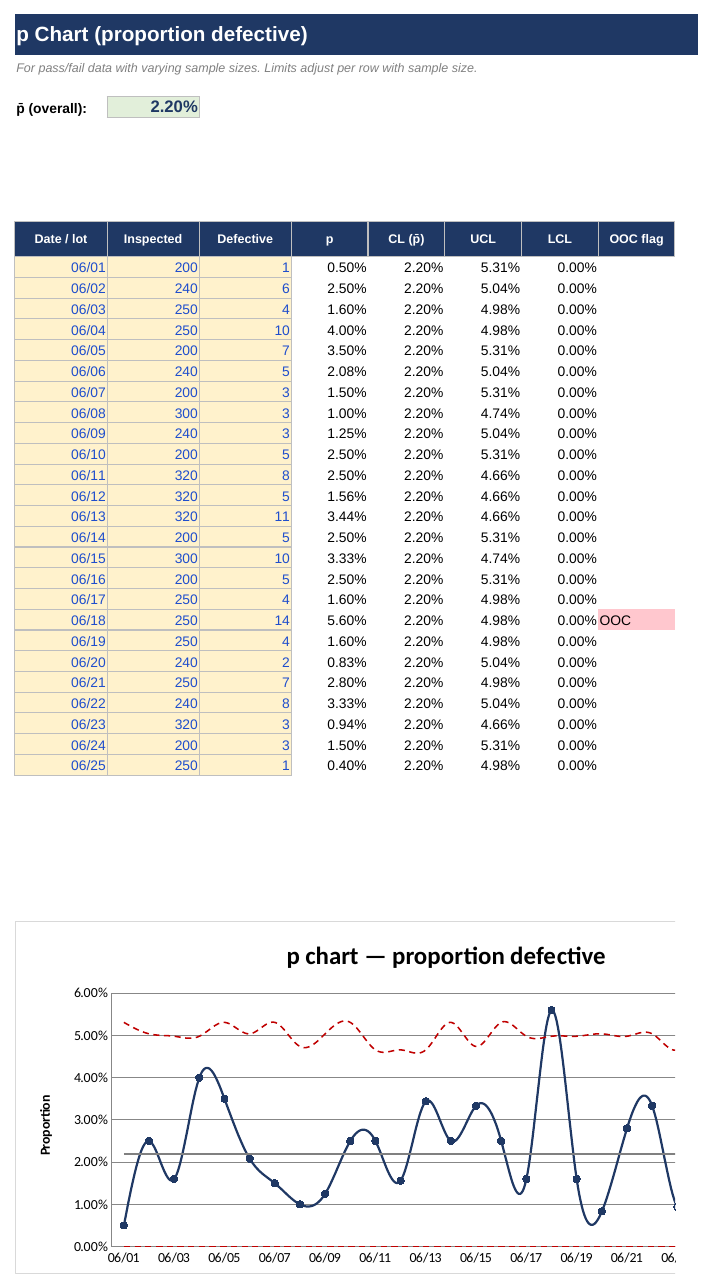
- p Chart — proportion defective with per-row varying limits
- Out-of-control AND run-of-8 flags on every chart
Every LineSide Tools workbook: Read Me tab with color legend • worked automotive example pre-loaded •
yellow inputs / locked formulas (no password) • no macros or add-ins • Excel 2010+ & LibreOffice • free updates for life.
Who it's for
Process and quality engineers who want real SPC on the floor without a Minitab license at every desk.
See inside
Actual screenshots of the workbook you'll download, showing the pre-loaded example data.
$34
One-time purchase. Instant download (.xlsx). Free updates.
Buy nowOr get all ten tools in the Toolkit for $129 — cheaper than five singles.
Pairs well with: Gage R&R / MSA Study